This is the second of the four problems on the A533B-1 welded plate, and the companion to Problem 1 LLAW . The two problems were designed for a single-variable comparison:
The shared background and method for all four problems are in the overview BS 7910 FAD Assessment: What Residual Stress Does, Seen Through a FITNET Case .
What this problem asks
LLHT = Low-$L_r$ + Heat-Treated: post-weld heat treatment (PWHT) applied, assessment temperature −120 ℃, low load ratio. It is at the same temperature as LLAW, in the same region, and uses the same set of measured residual-stress profiles — the only variable is PWHT. The heat treatment relaxes the welding residual stress by at least an order of magnitude (FITNET FFS Procedure MK7 (2006), Vol. II §13.2.5), so the residual $K_I^S$ drops from 46 in the as-welded state to 5 MPa·m$^{0.5}$. The load capacity rises accordingly, from LLAW’s 1.27 MN to 2.19 MN (about 1.7×).
The question this problem answers is the comparison question: if you relax the residual stress, how far does the assessment point fall back?
Principle: same yardstick, only the residual term changes
The assessment still follows BS 7910:2019 §7.3.3 Option 1, with coordinate definitions identical to Problem 1:
$$ K_r = \frac{K_I^P + K_I^S}{K_{mat}} + \rho, \qquad L_r = \frac{\sigma_{ref}}{\sigma_Y} $$Residual stress is a secondary stress, so it enters $K_r$ only, not $L_r$ (BS 7910:2019, §7.3.6). The only thing this comparison problem actually changes is the $K_I^S$ term in the $K_r$ numerator: from 46 to 5 at the deepest point.
As in Problem 1, both points of the semi-elliptical surface flaw are assessed, the deepest point and the surface point, and the flaw is not acceptable if either point is not acceptable (see “The principle in brief” in Problem 1 ). The PWHT profile also integrates to a negative value at the surface point (Annex M.4.2 with this problem’s geometry gives $K_I = -1.47\ \mathrm{MPa\cdot m^{0.5}}$ there), which BS 7910:2019 §7.3.6 sets to 0, so the surface-point $K_I^S$ is entered as 0.
Inputs at a glance
| Parameter | Value | Difference vs. LLAW |
|---|---|---|
| Crack depth $a_0$ / half-length $c_0$ | 18.6 / 87 mm | almost the same |
| Plate thickness $B=t$ / width $W$ | 71 / 600 mm | the same |
| Primary membrane $P_m$ / bending $P_b$ | 0 / 424 MPa | higher load (fracture load 2.19 MN) |
| Yield $\sigma_Y$ / tensile $\sigma_U$ | 596 / 772 MPa | similar |
| Fracture toughness $K_{mat}$ | 46 MPa·m$^{0.5}$ | PWHT weld @ −120 ℃ |
| Residual $K_I^S$ (direct input, deepest / surface point) | 5 / 0 MPa·m$^{0.5}$ | deepest point 46 → 5 (relaxed by an order of magnitude) |
Try it yourself: entering it in the calculator
One click: open this example in the calculator . The inputs are filled in for you. You can also pick “FITNET A533B residual stress — LLHT (post-weld heat treated, low load)” from the “Verification examples” list. The steps below are for checking or entering the inputs by hand.
The input steps are the same as Problem 1
: first pick Option 1 in the “Assessment Option (FAD)” card, then fill in the cards from “1. Crack / Flaw Type” to “7. Analysis Type & Plasticity Interaction”. Use the LLHT values from the “Inputs at a glance” table above: crack depth 18.6 and crack half-length 87; primary bending stress $P_b=424$; yield strength 596 and tensile strength 772; fracture toughness $K_{mat}=46$; set “Secondary (residual/thermal) load” to Enter K_I^S directly and enter 5 at the deepest point and 0 at the surface point. The plasticity interaction ($\rho$) source stays at the default Annex R (calculated) — default.
Results
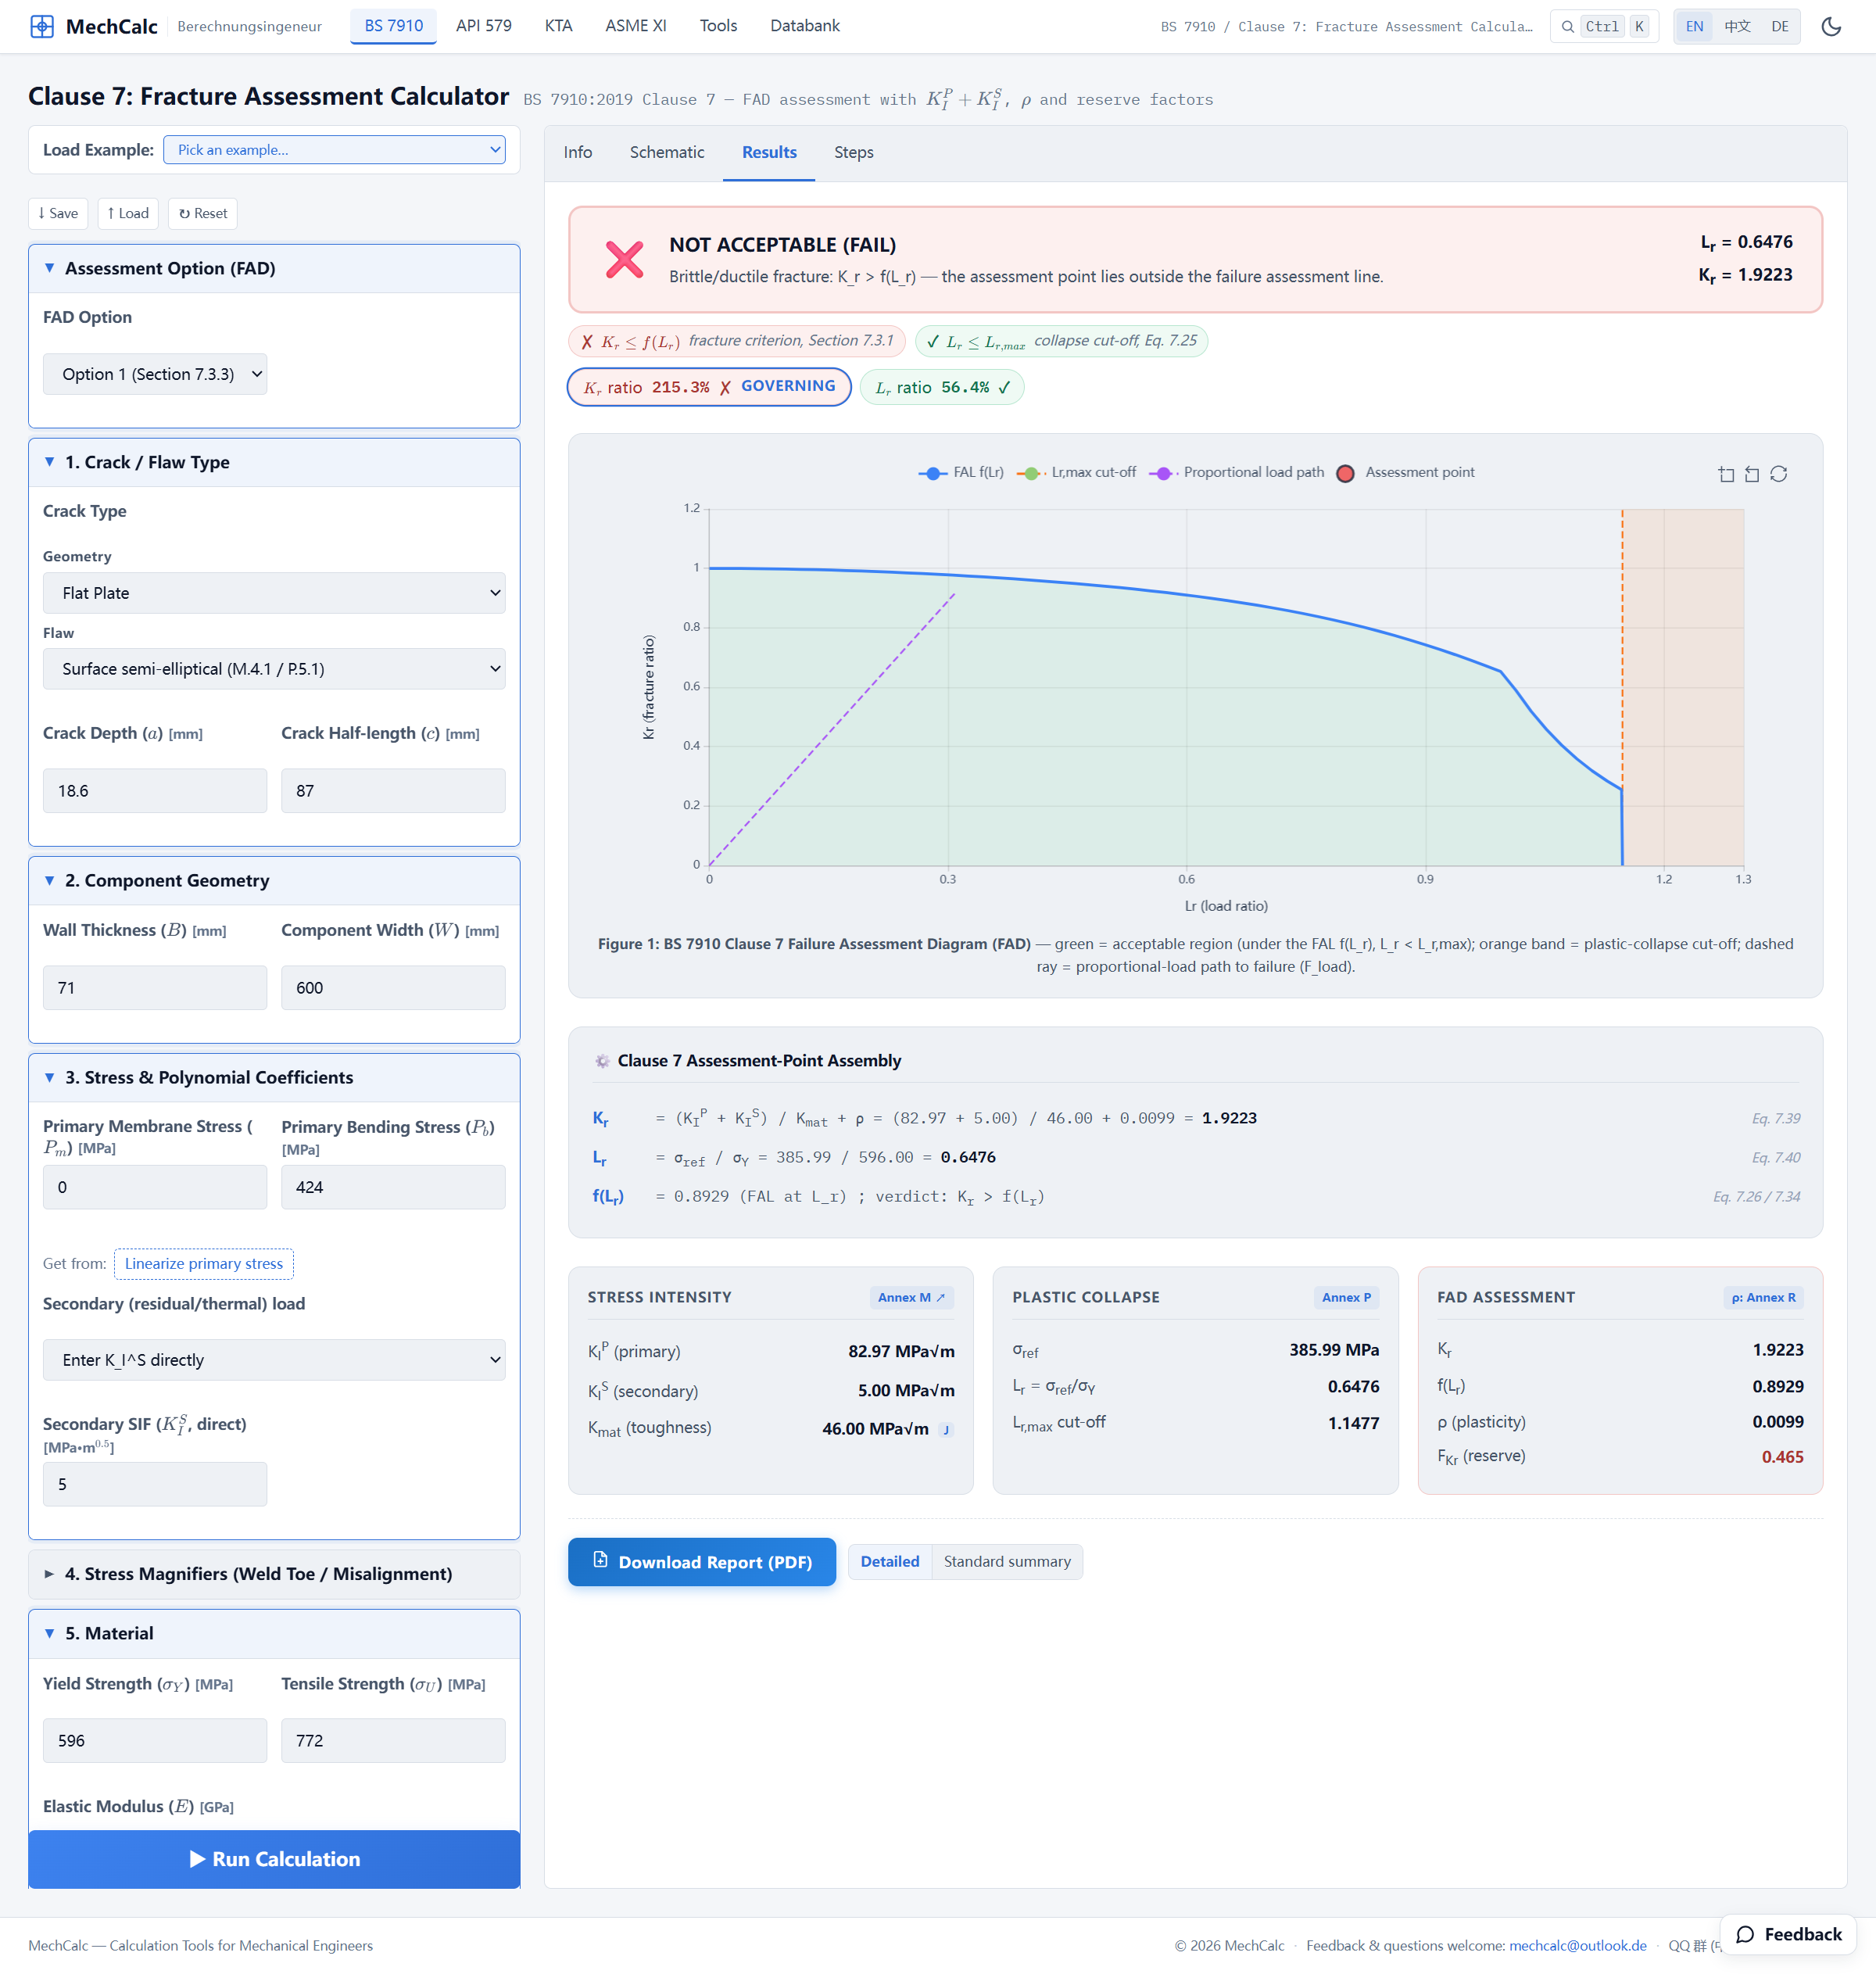 Figure 1: LLHT results. The banner says NOT ACCEPTABLE (brittle/ductile fracture): L_r=0.6476, K_r=1.9223 at the deepest point and 1.2257 at the surface point; both points lie outside the Failure Assessment Line. In the two-point table the deepest-point primary K_I^P=82.97 is higher than LLAW’s 48.13, but the secondary K_I^S is only 5.00 (LLAW was 46), so the assessment point lands lower.
| Quantity | LLHT deepest point | LLHT surface point | (LLAW deepest point for comparison) |
|---|---|---|---|
| Primary $K_I^P$ [MPa·m$^{0.5}$] | 82.97 | 56.38 | 48.13 |
| Secondary $K_I^S$ [MPa·m$^{0.5}$] | 5.00 | 0 | 46.00 |
| Plasticity interaction $\rho$ | 0.010 | 0 | 0.046 |
| Vertical axis $K_r$ | 1.92 | 1.23 | 2.59 |
| Reference stress $\sigma_{ref}$ [MPa] | 386.0 (both points) | 226.5 | |
| Horizontal axis $L_r$ | 0.648 (both points) | 0.367 | |
| FAL height $f(L_r)$ | 0.8929 | 0.9675 | |
| Verdict at this point | not acceptable | not acceptable | not acceptable |
| Margin on $K_r$, $F_{Kr}$ / reserve factor on load $F_{load}$ | 0.465 / 0.476 | 0.728 / 0.767 | 0.373 / — |
Reading the result: the counter-intuitive pair to watch
The most thought-provoking thing in this problem is a counter-intuitive result:
- LLHT’s primary stress intensity factor $K_I^P = 82.97$ is about 1.7 times LLAW’s 48.13 (because LLHT fractured under the higher load of 2.19 MN);
- yet its assessment point $K_r = 1.92$ is lower than LLAW’s 2.59.
The whole difference is in the secondary term: the as-welded residual $K_I^S = 46$, but after PWHT only 5 remains. Between that drop and the rise on the primary side, PWHT pulls the vertical coordinate from 2.59 back down to 1.92. This turns “residual stress is harmful” from a qualitative statement into a quantifiable increment on the FAD vertical axis — in the brittle-fracture-governed low-$L_r$ region, as-welded residual stress can contribute a $K_I^S$ on the same order as the primary stress.
Both are judged not acceptable (both did fracture in the test), but PWHT lets LLHT carry 1.7× the load before fracturing — which gives a quantitative argument for post-weld heat treatment of important welds. For LLHT both the deepest point and the surface point lie outside the curve; the reserve factor on load is $F_{load}=0.476$ (from the deepest point), so the primary load would have to drop to about 48% of its value before the deepest point comes back onto the Failure Assessment Line. Unlike LLAW, the residual term here is too small to push the point outside the curve on its own, so $F_{load}$ has a value.
Comparison with the FITNET result
As before, here is this problem’s assessment against the FITNET original (FITNET FFS Procedure MK7 (2006), Vol. II §13.2.5, Table 13.10), term by term. The mechCalc column is the governing deepest point:
| Quantity | mechCalc (deepest point) | FITNET original | Difference |
|---|---|---|---|
| Primary $K_I^P$ [MPa·m$^{0.5}$] | 82.97 | — | — |
| Secondary $K_I^S$ [MPa·m$^{0.5}$] | 5.0 | 5 | same source |
| Load ratio $L_r$ | 0.648 | 0.64 | +1.2% |
| Fracture ratio $K_r$ | 1.92 | 1.89 | +1.7% |
Note: the FITNET original (Vol. II §13.2.5, Table 13.10) lists only $K_r$ and $L_r$, not $K_I^P$, so the FITNET column shows “—”.
In the low-$L_r$ region the two procedures again agree closely: $L_r$ differs by 1.2% and $K_r$ by 1.7%, both within ±2%. Both procedures show the same trend: PWHT pulls $K_r$ from 2.59 back to 1.92 (the FITNET original gives 2.58 and 1.89).
Source: the FITNET project’s Case Studies for Fracture, case “A533B-1 Steel Residual Stress Experiments”; original test report C C France, J K Sharples & C Wignall, AEA Technology Report AEAT-4236 (SINTAP/TASK4/AEAT18, 1998); the LLHT fracture load of 2.19 MN and the assessment inputs are in FITNET FFS Procedure MK7 (2006), Vol. II §13.2.5, Tables 13.9 / 13.10. The residual $K_I^S$ is from the same source on both sides; the primary SIF and limit-load solutions come from different sources (FITNET uses Sharples & Clayton / Sattari-Far, mechCalc uses BS 7910 Annex M / Annex P).
Next: raise the temperature to −30 ℃ and increase the load into the high-$L_r$ (large-plasticity) region — is residual stress still that important? See Problem 3 HLAW .
🧮 Online calculator: BS 7910 Clause 7 Fracture Assessment Calculator — Try it yourself: load the LLHT example in one click, or enter the inputs from the table above (K_I^S entered directly: 5 at the deepest point, 0 at the surface point), to get L_r=0.648 and K_r=1.92 at the deepest point.
Verification manual for this calculator: BS 7910 Fracture Assessment Calculator verification manual